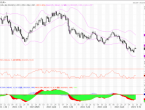
Currency: EUR/USD
Resistance 2: 1.1680
Resistance 1: 1.1640
Spot price: 1.1619
Support 1: 1.1595
Support 2: 1.1525
The US dollar was weak during the US session, and the euro/US dollar traded near the intraday high of 1.1610. US economic data was weaker than expected, and US stocks performed better after falling European and Asian stock markets, boosting the euro/dollar. At present, the focus of the market is still on the yield of U.S. Treasuries, which is the most concerned indicator of inflation pressure in the market. The 10-year U.S. Treasury yield once hit a high of 1.627%, but then quickly fell below 1.60%, further increasing the weakness of the dollar at the close. On the daily chart, the bullish momentum for the euro/dollar is still limited. The stable and bearish 20 SMA constitutes resistance, while the large-level moving average maintains a bearish tendency and is above the short-term moving average. The kinetic energy of technical indicators is not balanced. They are regaining lost ground, but remain in the negative zone, indicating that the exchange rate will consolidate rather than bottom out. The 4-hour chart shows that the EUR/USD is above the 20SMA and 100SMA, and the short-term moving average is about to cross the long-term moving average. The kinetic energy indicator was flat near the midline, and the relative strength indicator fell from the intraday high and is still above the midline. If the euro/dollar breaks through 1.1640, the exchange rate may continue to rise, if the euro/dollar breaks below 1.1595, the short position may increase.
Currency: GBP/USD
Resistance 2: 1.3820
Resistance 1: 1.3750
Spot price: 1.3744
Support 1: 1.3690
Support 2: 1.3640
Data show that the monthly rate of retail sales in the United States in September was the same as the previous value, an increase of 0.7%, unexpectedly better than expected -0.2%, and the previous value was revised up from 0.7% to 0.9%. The monthly rate of core retail sales increased by 0.8%, which was also better than expected 0.5%. The beautiful data and the impressive performance of Bank of America's earnings report that week boosted market risk appetite. Among the risky currencies, the pound is clearly the leader, because the UK's interest rate hike expectations are constantly rising. However, it is still under the pressure of the downward trend line since the high point of the year. The daily chart regained the ground lost earlier with the big Yang line, and the recent rebound has been strong. However, the current test of the downward trend line since the July 30 high is still cautious about further upwards. The 4-hour chart broke through the previous day's callback high, but the stochastic indicator diverged bearishly. The hourly chart oscillates ascending short-term and there is a callback signal above 1.3770. Only above 1.3820 is above the breakthrough, which shows a clear upward trend.
Currency: AUD/USD
Resistance level 2: 0.7478
Resistance 1: 0.7440
Spot price: 0.7424
Support 1: 0.7385
Support 2: 0.7330
The weekly chart shows that the AUD/USD seems to be preparing to continue the upward trend. The AUD/USD has expanded its rebound from the flat 100 SMA, and was above the bearish 20 SMA last week. At the same time, the technical indicators remain upward, about to cross the midline and enter the positive zone.
The daily chart shows that the AUD/USD may be close to finishing down. AUD/USD is currently trading directly above the mildly bearish 100 SMA, while the technical indicators are near the overbought indicators, losing bullish momentum. AUD/USD faced strong resistance at the monthly high of 0.7477 in September. If AUD/USD breaks through the resistance, it will approach the 0.7600 area. In addition, if the AUD/USD drops below 0.7330 and falls to the 0.7200 area, the AUD/USD will turn bearish.
Wang Gang, Bank of China Guangdong Branch
Source: Bank of China official website
Original Title: Forex Market Watching on October 19, 2021