Watching the foreign exchange market on October 12: technical analysis of the euro, the British pound and the Australian dollar
Currency: EUR/USD
Resistance 2: 1.1640
Resistance 1: 1.1580
Spot price: 1.1549
Support 1: 1.1500
Support 2: 1.144
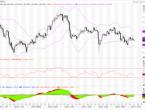
The EUR/USD traded near 1.1560, which was slightly lower than when it closed last Friday. At the beginning of the week, the market opened slowly, and the market tried to clarify the direction. The US market is on a holiday and the bond market closes, which may help curb risk-related sentiment. Economic events in the euro zone are relatively quiet, and the chief economist of the European Central Bank, Philip Ryan, said that adjusting the scale of asset purchases plays an important role in ensuring that monetary policy is loose enough and the medium-term inflation target of 2% is achieved in time. In addition, he pointed out that "a one-time change in salary levels is part of a temporary and unexpected increase in price levels, and does not mean that there is a trend change in the path of potential inflation." The euro/dollar remained at the 1.1550/60 price zone, maintaining a bearish tendency. The daily chart shows that the EUR/USD is below the bearish moving average, and the 20 moving average constitutes resistance, which is about 100 points above the current price. The technical indicators face south and are in a negative zone, in line with the overall trend. The short-term 4-hour chart shows that the exchange rate is consolidating near the mildly bearish 20 SMA, while at the same time below the stable and bearish large-level moving average. At the same time, the technical indicators have fallen, the kinetic energy indicator consolidated near the midline, and the relative strength indicator is facing downward, near 41, indicating that the bears are still dominant. If the euro/dollar breaks the support level of 1.1520, it is expected to deepen downward.
Currency: GBP/USD
Resistance 2: 1.3722
Resistance 1: 1.3663
Spot price: 1.3585
Support 1: 1.3530
Support 2: 1.3412
On Monday (October 11), the British pound gave up most of the intraday gains against the U.S. dollar. It is currently rising slightly, mainly suppressed by the strong U.S. dollar. The pound against the dollar once climbed to a high in the past two weeks, near the 1.3670-75 area, but it was immediately blocked by airdrops. The September non-agricultural employment data released on Friday was disappointing, but it was offset by a sharp upward revision in the data last month, and reiterated the Fed’s expectation that the Fed will soon begin to reduce the scale of asset purchases. The market also seems to have increased their bets on the Fed's interest rate hike in 2022. Concerns about the recent surge in crude oil prices will trigger inflation, prompting market speculation that the Fed may tighten policy ahead of schedule. The combined effect of these factors pushed the benchmark 10-year U.S. Treasury bond yield to a four-month high, breaking the 1.60% mark last Friday. This, in turn, continued to promote the US dollar and inhibited the subsequent strong and positive trend of the pound against the US dollar. At the same time, concerns about a comeback of stagflation (high inflation, low growth) have reduced investor interest in high-risk assets. This is evident from the weakening of the stock market, which is seen as another positive factor for the safe-haven dollar. From a technical point of view, the pound's upward momentum has slowed down significantly, and it has fallen into a shock trend in the short term. Against the background that the US dollar index is expected to continue to strengthen, the pound may resume its downward trend. The lower support levels focus on 1.3600, 1.3567, and 1.3531, and the upper resistance levels focus on 1.3663, 1.3722, and 1.3751.
Currency: AUD/USD
Resistance level 2: 0.7425
Resistance 1: 0.7370
Spot price: 0.7338
Support 1: 0.7266
Support 2: 0.7200
AUD/USD continued to rise to a new 4-week high of 0.7372, and is currently trading near 0.7350. The soaring copper price boosted the Australian dollar. On Monday, copper prices rose by 0.7% to US$8,560 per ton. AUD/USD is below the 61.8% retracement of the recent daily decline, trading between 0.7477 and 0.7169. The daily chart shows that the exchange rate may continue to rise, and the technical indicators remain steady upwards, in a positive zone. At the same time, the exchange rate has continued to rise above the current flat 20 moving average, while the 100 moving average maintains a bearish tendency and is currently near 0.7425. The recent trend of AUD/USD indicates that the upward momentum of the exchange rate has been exhausted, but it is not enough to indicate that the exchange rate will fall. The 4-hour chart shows that the AUD/USD is above all moving averages, the 20 moving average is up, and it is about to cross the 200 moving average. However, technical indicators are falling from their intraday highs and remain in the positive zone. If the AUD/USD breaks the support 0.7330, there will be a finishing decline.
Wang Gang, Bank of China Guangdong Branch
Source: Bank of China official website
Original Title: Forex Market Watching on October 12, 2021


