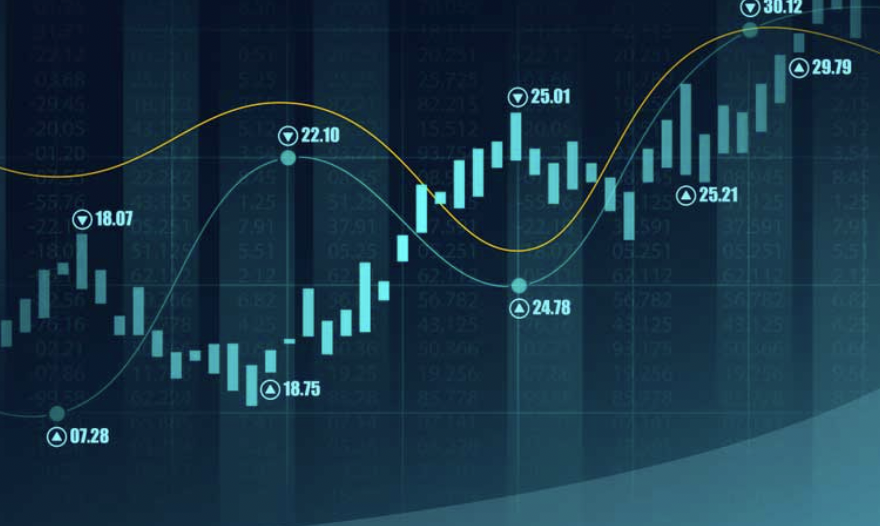
Only a few technical analysis kinds accessible for understanding the financial markets. The most prevalent method is momentum analysis, which examines current market forces by applying mathematical indicators to a price. Moreover, fundamental bias analysis relies on fiscal economics data releases, mathematical standard deviation-based analysis, key levels analysis, which employs daily pivots, Fibonacci levels, daily highs and lows.
However, none of these widely used analytical techniques address the central question of why pricing acts at a given price level. When price approaches a significant level, several eventualities might be expected: price may reverse, retrace briefly and break the level, break the level, or false break the level (aka, Fake-out).
The Order Flow Trading Strategy provides a precise definition for critical levels, but it also includes a unique aspect: how powerful the resistance at that level may be.
The first and most crucial question is the act of buying or selling security, and closing the deal before the day or session ends is known as day trading. To put it simply, traders begin the day with cash and conclude it. It is not a job. They aim to enter a long contract and exit it at a better price point, in this case, trading order flow using futures. They aim to exit at a cheaper price point if they enter a short contract. This is how they profit from day trading. Top1 Markets trades the futures market, the world's most liquid market with asset opportunities everywhere. The trading hours are incredible, as are the money requirements. They may be subject to the Pattern Day Trading Rule, but futures trading is exempt.
What is Order Flow Trading?
Order flow trading is a strategy of predicting price movement based on existing orders visible on both the buy and sell sides. How many bids are there compared to asks? The unknown aspect, of course, is the number of buyers and sellers who enter the markets unexpectedly (or traders who might know if any large buyers or sellers are about to jump in).
For whatever reason, many traders have a difficult time grasping this concept. So let us start with a story and go back a few centuries to the early 1800s to see order flow.
For example, the Philadelphia Stock Exchange receives word that a corporation is bankrupt, and short-sellers drive the stock. Meanwhile, several opportunistic traders, realizing that the news has not yet reached New York, spot an opportunity to profit.
Information moves at the same rate as the quickest equestrian. As a result, these traders, all riding fast horses, decide to make a beeline for New York, arriving just in time for the "opening bell" the next day. Armed with the most recent news (that the company is going bankrupt) and a fair estimate of the number of sellers who may outweigh buyers, the traders dive into the stock, selling it short at every chance.
Despite the stock's increasing slide, enthusiastic buyers continue to support it. That is until the news starts to spread. Nonetheless, not every buyer is aware of the company's impending collapse. Moreover, much over the company's actual value, every bid they submit is met with market sell orders until the stock is destroyed. Finally, everyone on the trading floor hears the news.
Order flow analysis is a novel concept in trading analysis. idea that can assist individuals to identify where orders imbalance will occur at a future price level with a high degree of confidence. This enables people to enter the market with greater precision and confidence.
Order Flow Trading Strategy
Before we go into detail about applying the order flow trading method, we will take a moment to demonstrate how the footprint chart works.
You are probably wondering how to use the Footprint Charts by now, and these charts might help you to develop a more thorough understanding of the market.

The footprint charts feature all the price and order flow data (volume). The footprint chart shows the volume transacted at each price for each bar and price level. Let us get started with the footprint charts and go over some of the essential concepts of trading order flow.
Each footprint chart contains three bits of information:
Each row on the footprint chart grows at a different price.
In the cell, the bid-ask volume indicator is displayed.
The flow of orders (green numbers show aggressive buying and red numbers show aggressive selling).
What is Order Flow Tools?
For order flow, we employ several tools. The depth of market, or market ladder, for a futures asset displays buyer and seller interest at various levels. These are contracts that have not yet been traded on the market. The following graphic is the footprint, which shows the market orders executed. On this chart, bids and asks are shown numerically, which shows traders where buyers and sellers came in to defend their positions.
The Order Flow Trading Tools We Use
In terms of order flow trading tools, we employ footprint charts.
The footprint chart demonstrates how aggressive the buyers and sellers are. We may utilize this data to determine where the large inventory of orders is located and compare it to what the market is doing.
The market's current status is indicated by the trail of actual transactions, not those promoted (called limit orders) as potentially occurring if we hit a specific price.
The purpose of order flow trading is to react based on market action as measured by daily volume traded. The market orders are depicted on the footprint chart (all filled orders). This allows us to compare the bid volume to the ask volume and determine who controls the market.

Order Flow in the Market Today
The old-school mindset may persist in today's electronic markets, but the mechanisms, technologies, and rules governing order flow have changed.
As it has always been, order flow is the process that moves prices up and down, and it is the equilibrium or disequilibrium of buyers and sellers (bids and asks). The flood of market sell orders overwhelms the limit order sellers, or the market buys overwhelm the limit order sellers.
To understand how order flow works, traders must first comprehend how the interaction of the Depth of Market and Market Orders dynamically forms the order flow process.
Understanding the Depth of Market
This is a price ladder based on the Depth of the Market, also known as a DOM.

There are three columns: one on the left, one in the middle, and one on the right.
Column in the Middle
This is where prices are displayed (in this case, prices for the ES or E-Mini S&P 500).
Column on the Left
This is where buyers place their limit orders on the Bid side.
The green numbers represent the total bids placed on each price point.
These bids are limit orders, implying that the buyer wants to purchase a specified quantity of contracts at this price or below (meaning lower).
Ten bid levels correspond to a specific price level (limit orders above the tenth level are not visible because most platforms have a DOM limit).
Column on the Right
This is the Ask side, which is where sellers place limit orders.
The red figures represent the number of asks placed on each pricing point.
These are also limit orders, signifying the number of contracts a seller would like to sell at this price or higher (meaning higher).
There are ten different degrees of request.
The current price, indicated in blue, is when the most recent deal occurred–someone purchased contracts from another who sold them to them.
The duo with the best bid and best ask is the one that is closest to one another.
The bid-ask spread is the difference between the "best ask," 2168.00, and the "best bid," 2167.75. As you can see, there is a 0.75 spread, which equates to 1 tick.
Recognize the Entry by Order Flow
People that base their analysis on historical levels and know what level they are looking for have a significant advantage in their trade. This advantage will give them the edge of buying at a low price and selling at the highest, most expensive price. It will also provide them with the satisfaction of knowing their trade ahead of time, allowing them to arrange subsequent orders to be filled later whenever the price reaches the mark. This decreases screen time and makes their trading routine comfortable and straightforward, giving them enough time to be an analyst and well prepared for trades.


Because order flow is the essence of price movement, this trading strategy is suitable for any time frame. It works with charts, including monthly, one-minute, and tick charts.
Recognize the Exit by Order Flow
Exit is determined by order flow in the same way that entry is. We may always expect the price to shift when it reaches a substantial change in the past. We can design the opposite end of the trade cycle as a safe exit with this information. As long as the price is current by historical standards, we can build an entire trade, place it on a limit pending order, wait for it to be executed, and enter the target.

How to Analyze Order Flow
Gaining an advantage in order flow is difficult because people constantly read past information. In order book data, people can only view limited orders–that is, they cannot see market orders until they jump in.
Nonetheless, "footprint" software is available to help users better speculate if a price move signals short-term bullishness or bearishness by interpreting the imbalance of orders and trades.
This is a lot to take in at once, so let us break it down. Consider the following scenario.
In a footprints charts:
Bids that have been filled (sold) are shown on the left.
The filled (purchased) requests are on the right.
Diagonally match the bids and asks.
So if we see the following:

We match 29 (bids filled by sellers) to 31. (asks that were filled by buyers). As a result, sellers filled 29 bids while buyers filled 31 asks. Isn't that reasonably balanced? 29 to 31 yields a bid-to-ask ratio of 93% and an ask-to-bid ratio of 106%?
Overall, it is close to a perfect match, and it is pretty well-balanced.
You are looking for discrepancies between bids and asks filled in a footprints chart. Imbalances generally cause price movement.
And here is the kicker: if you can detect the imbalance, you may have greater insight into order flow than someone who cannot.
So, if you look at the chart below, you can see that there is an imbalance to the downside because the selling pressure (194 contracts) was 625.81 percent more than the buying demand (of 31 contracts). The numbers on the left side will be highlighted in red to indicate an imbalance, and this implies a possible negative trend.

In the opposite case, the buying pressure is 444.83 percent more than the selling pressure. As a result, it is highlighted in green to signify an imbalance, which signals a possible bullish trend.

Materials to Help You Become an Order Flow Trading Expert
We sorted all of the material into the following categories for your convenience:
Trading products that are beneficial to both novice and experienced traders
How do experienced traders employ Order Flow in their trading? Examine expert interviews on order flow analysis.
Webinars featuring real-world examples and deals
Mechanics of the Market
The best method to comprehend the market is, to begin with, the Market Mechanics intensive. This essay does not necessitate any prior experience in trading, and it contains information that can be used in a variety of markets.
A Crash Course in Trading Risk Management
You may be able to regulate the dangers and emotions if you are a trader. And it doesn't make any difference how much experience you have. This FAQ will explain why your trading strategy will perform poorly if not updated. Also covered are how to protect your money with SL and TP and if the Martingale Strategy works.
Luis Recabarren, a Trader and Private Equity Manager
Luis walks us through his trading process in this interview. He describes his market analysis and trading decisions.
Bret Bossenberry, Futures, Options, and Stock Trader, was interviewed
Bret Bossenbery is an accomplished trader. He is willing to give up around ten years for the time being. He is confident that fear and greed are the most potent market-driving drivers. He discusses his trading method and some amusing stories from his professional and personal life.
Trading Tactics Optimization by John Plazas
John Plazas is a seasoned trader. His strategy solution incorporates quantitative models as well as behavioral inputs. As a result, this strategy is well-balanced and methodical. John Plazas pinpoints entries and exits based on order flow in his strategy.
Ferran Font Ramentol, a professional trader, explains his trading strategies.
Ferran Font is a skilled trader. Learn how Ferran Font incorporates Order Flow into his trading strategy and what he gains from it.
Order Flow Trading Strategy Summarized
All trading strategies, analyses, and plans are dependent on the trader who employs them. The appropriate analysis can lead to profitable trading with the right mindset. Trading Order Flow, on the other hand, provides day traders with a significant advantage in terms of trade execution. They benefit from order flow in the following ways:
A straightforward notion for learning and comprehending market behavior.
A high risk/reward ratio
Exit and entrance signals with high precision
Works on all high-liquidity trading assets, including forex, stocks, commodities, indices, and futures.
It is the same for any timeframe.
An approach that can be used in conjunction with nearly any other trading strategy.
Perfect for a set-and-forget trading strategy based on established price levels and limit orders.